Viewing call ratings in Real-time Analytics
If enabled for your account, agents can rate audio quality of their calls. Using dashboards in Real-time Analytics, you can display various statistics regarding the usage of Post Call Quality Rating, as well as view Mean Opinion Score (MOS) ratings. MOS is an average of ratings added by agents.
For information about using the Post Call Quality Rating feature in ContactPad, see Rating call quality in ContactPad. For information about configuring the Post Call Quality Rating feature, see Configuring post call quality rating.
In this page |
|---|
How do I display MOS for my account?
You can display MOS rating for an account using the Big Number widget. Configure the widget to include all ratings added by all agents in that account and present them as a MOS. MOS is always displayed as a decimal number.
Example
For the Agents type, group by Agents and add the following metrics to your Big Number widget:
MOS (Agents)
Define Thresholds in the Widget Configurator to have your MOS rating colored. Suggested thresholds are:
Red (low): 1.0-2.5
Amber: 2.6-3.9
Green (high): 4.0-5.0
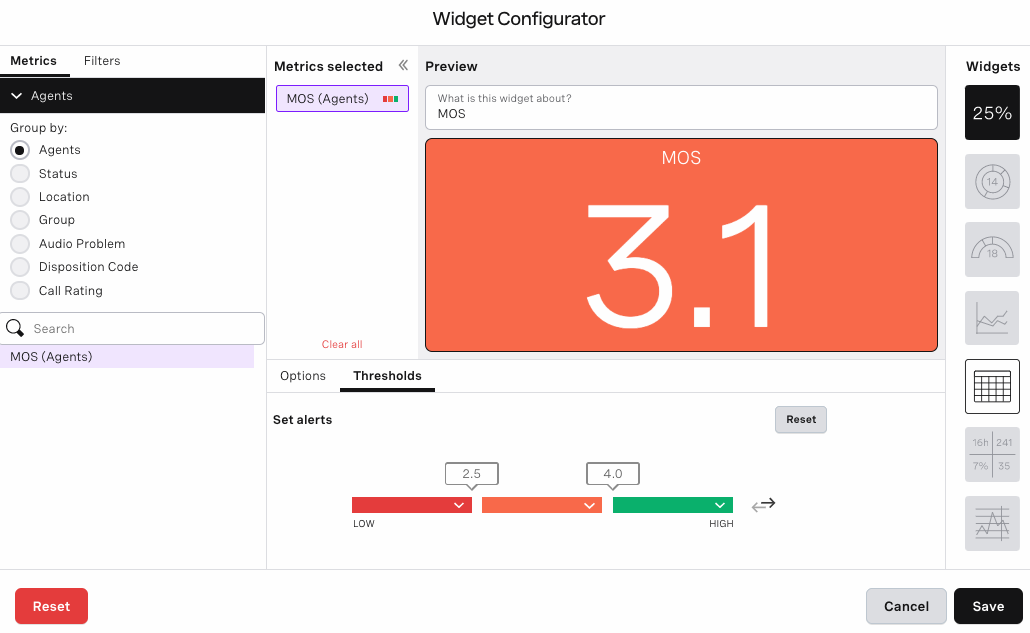
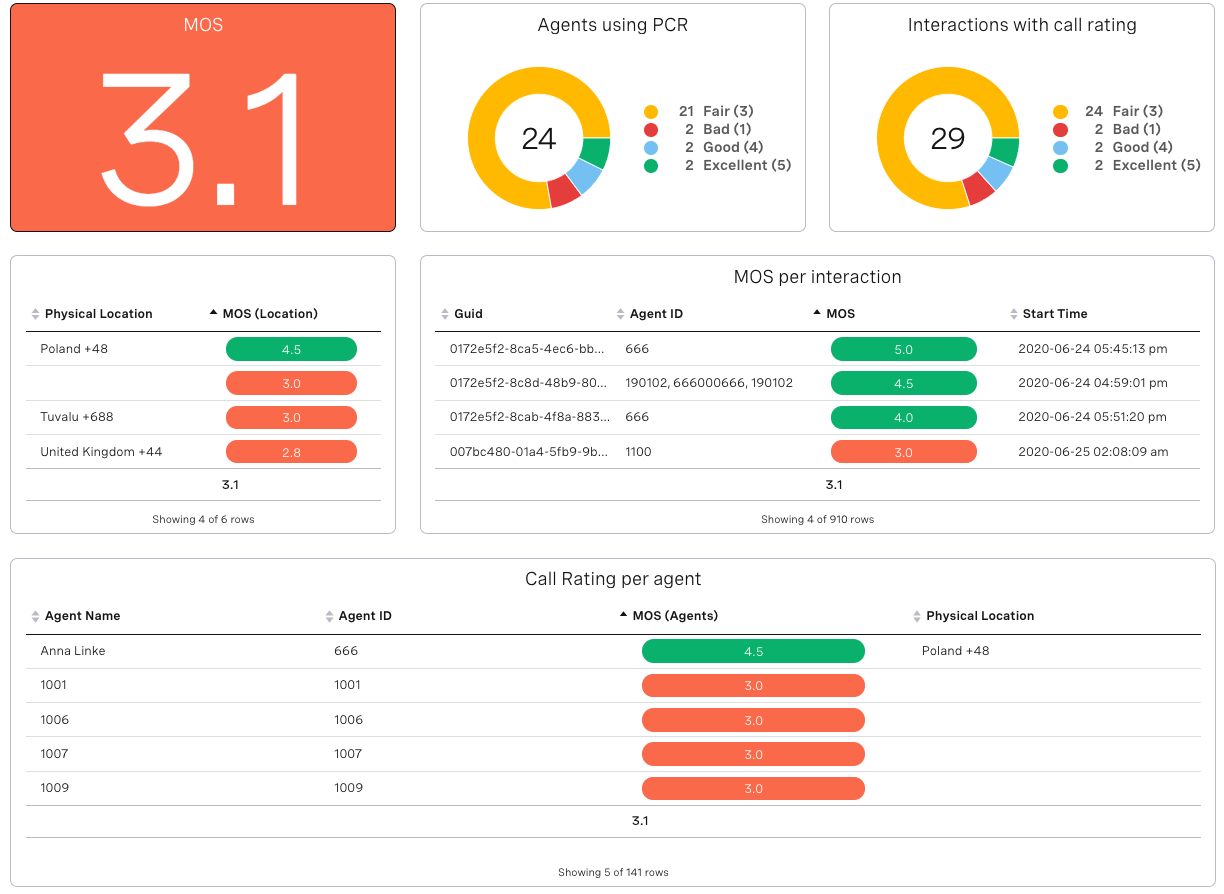
In the example above, the mean opinion score calculated for all agents in the account is 3.1.
How do I display MOS for individual agents?
You can display MOS rating for individual agents using the List widget. Configure the widget to list all agents who rated calls in that account along with a mean opinion score calculated based on all their ratings.
Example
For the Agents type, group by Agents and add the following metrics to your List widget:
MOS (Agents)
Agent ID
Physical Location
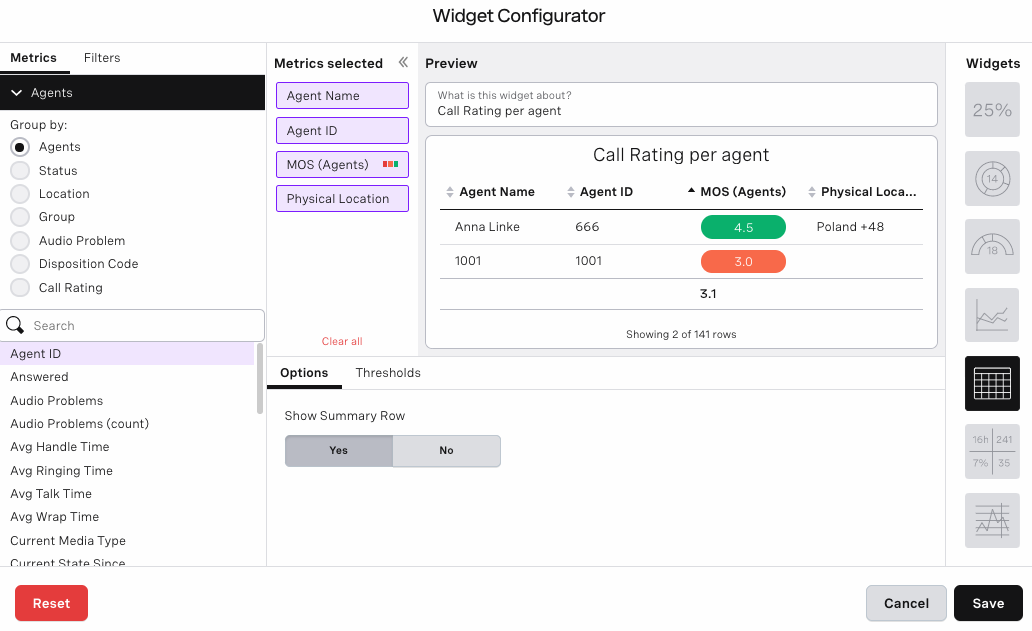
In the above example, you can see MOS scoring per agent, as well as the location and IDs of agents who used the Post Call Quality Rating feature in this account.
How do I display MOS grouped by agent locations?
You might be interested to see how your agents rate call audio quality in different regions to look for potential issues. To do that, use the List widget.
Example
For the Agents type, group by Location and add the following metrics to your List widget:
MOS (Location)
Define Thresholds in the Widget Configurator to have your MOS rating colored.
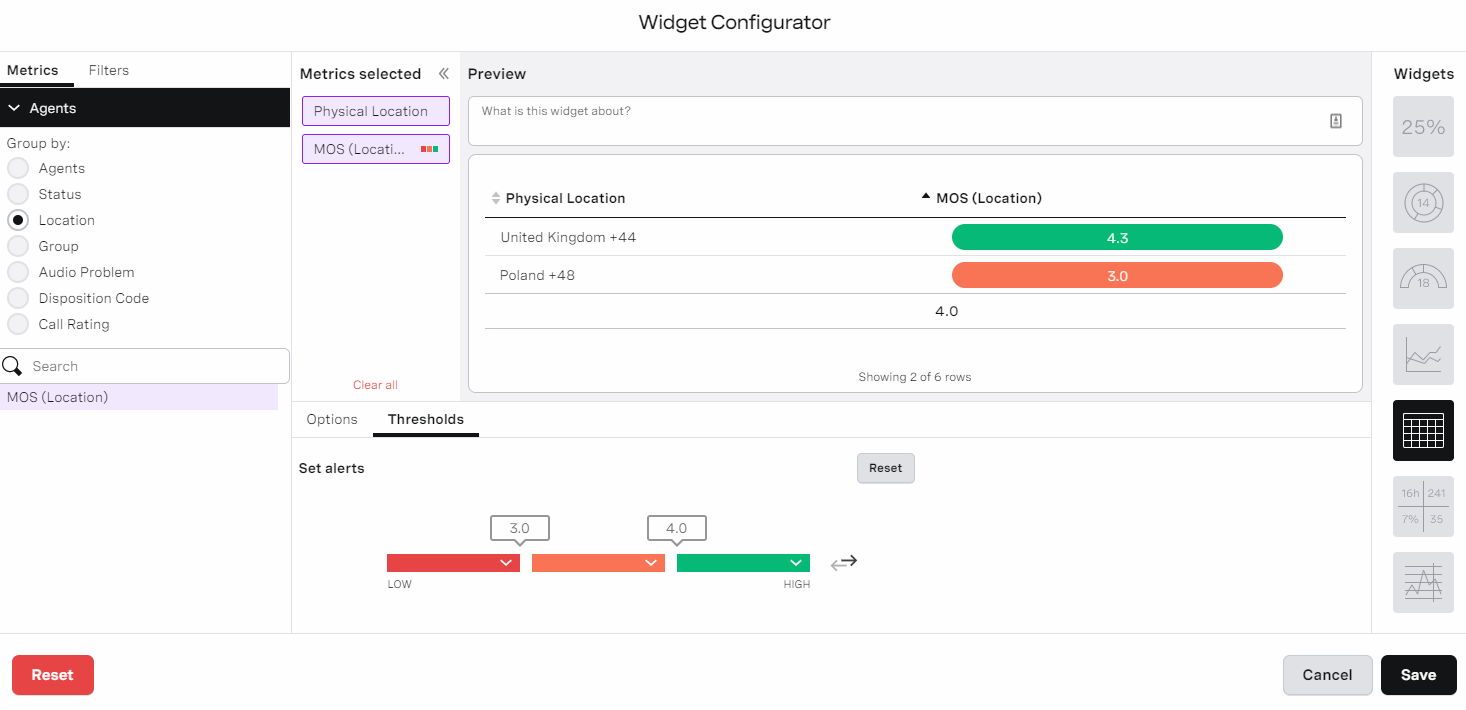
In the example above, you can see two out of six MOS by location scores, one for agents with their physical location in Poland, and one for agents with their physical location in the United Kingdom.
How do I display the number of agents who used the Post Call Quality Rating feature?
To display how many agents rated their calls and, optionally, used a specific rating, use a Donut widget.
Example
For the Agents type, group by Call Rating and add the following metrics to your Donut widget:
Agent (count)
To see what ratings were used, select a legend placement in the Options area in the Widget Configurator.
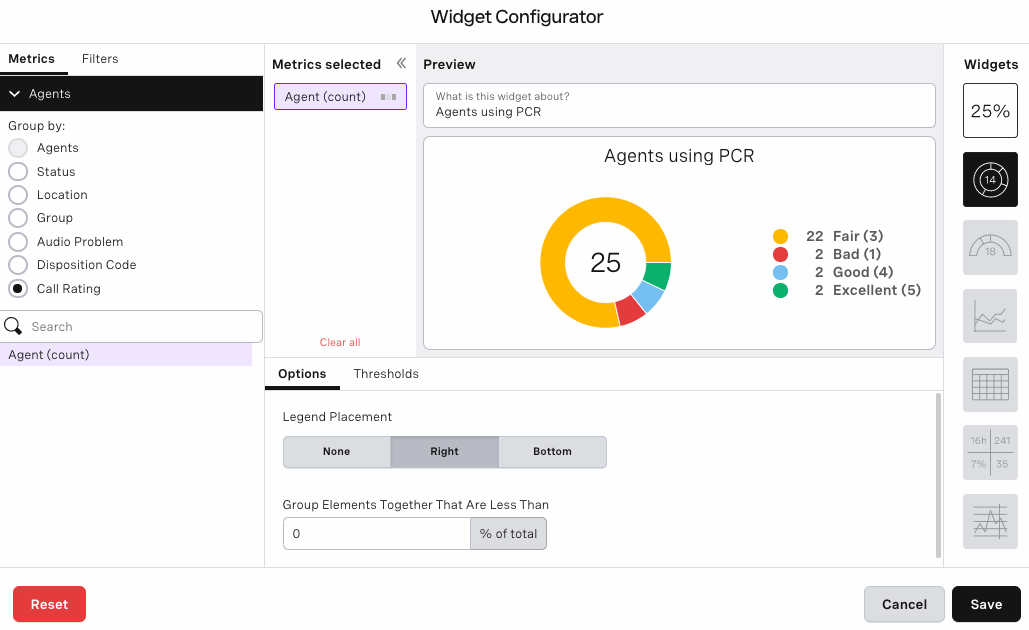
In the example above, 25 agents used the Post Call Quality Rating feature. 22 agents rated at least one of their calls as Fair (3), two agents rated at least one of their calls as Bad (1), the agents rated at least one of their calls as Good (4) and the agents rated at least one of their calls as Excellent (5). No agent used the Poor (2) opinion score when rating their calls.
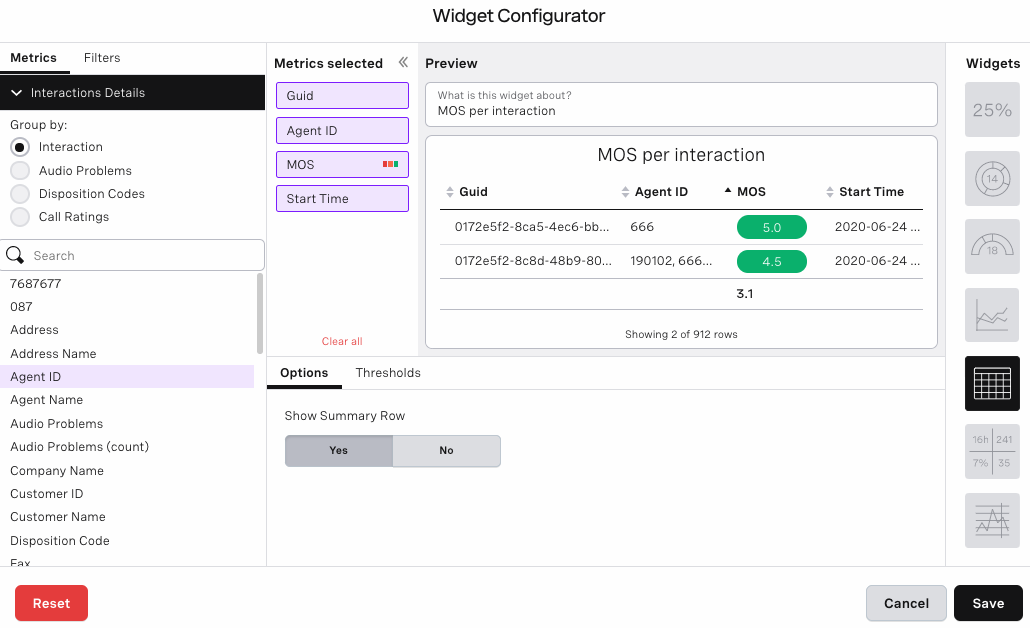
How do I display MOS per interaction?
You can display MOS rating per interaction using the List widget.
Example
For the Interaction Details type, group by Interaction and add the following metrics to your List widget:
Agent ID
MOS
Start Time
How do I display the number of interactions rated using the Post Call Quality Rating feature?
To display how many interactions were rated, use the Donut widget.
Example
For the Interaction Details type, group by Call Ratings and add the following metrics to your Donut widget:
Interactions (count)
To see what ratings were used, select a legend placement in the Options area in the Widget Configurator.
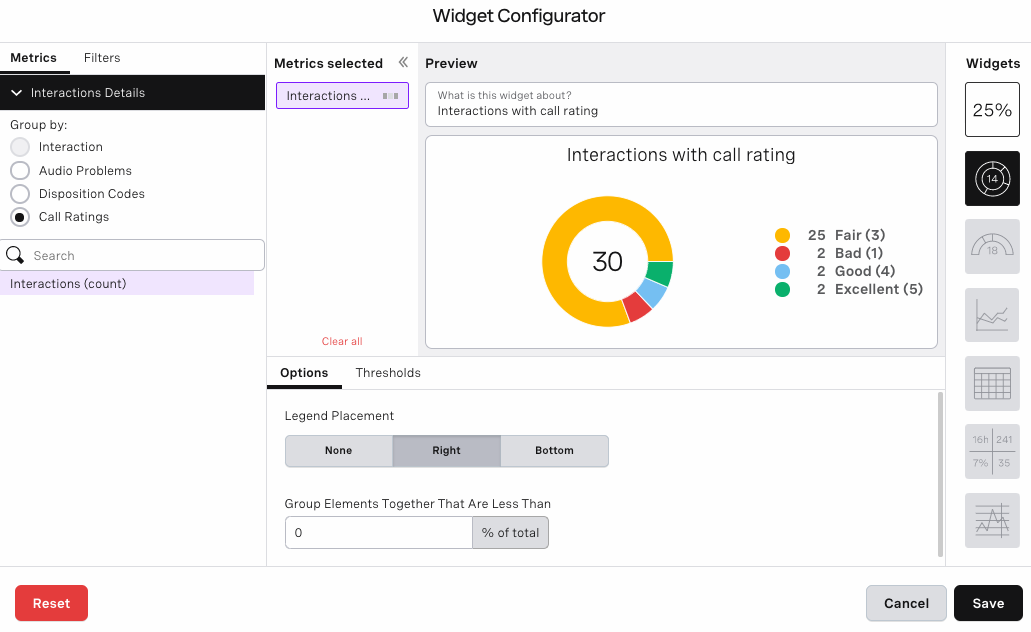
In the above example, there were 30 interactions rated using the Post Call Quality Rating feature. 25 were rated as Fair (3), 2 as Bad (1), 2 as Good (4) and 2 as Excellent (5). No interactions were rated as Poor (2).
The number of ratings in the legend will normally add up to the number of interactions. However in this case, there were two ratings for one of the interactions which might have resulted from a call transferred.
Example dashboard
For general assistance, please contact Customer Support.
For help using this documentation, please send an email to docs_feedback@vonage.com. We're happy to hear from you. Your contribution helps everyone at Vonage! Please include the name of the page in your email.