Overview of Real-time Analytics
The Real-time Analytics area of the VCC Admin Portal contains dashboards configured for your account. Dashboards are made up of various components—widgets—that represent past and current activity in your account. The widgets contain different types of information depending on their configuration.
What are Real-time Analytics dashboards?
A dashboard is a collection of widgets, displaying agent and queue statistics. Dashboards display information about all types of interactions.

What are widgets?
A widget is an item on a dashboard, containing configured data. Widgets display Vonage Contact Center metrics, optionally filtered (by timeframe, queue, media type, and so on), in the chosen visualization style (gauge, donut, and so on). Using widgets you can see a picture of current and past activity in your VCC Admin Portal account.
What type of data does a widget display?
Dashboards can contain several different types of widgets each displaying different types of data and different information about that data.
Widgets contain data about agents, interactions, and queues. A widget can contain one type of data at any time. Widget data can be grouped by or filtered by various metrics.
Agents
Widgets configured to display agent-related data might contain the number of interactions agents have handled, the time agents spent in each presence state or handling those interactions, or a combination of these.
Agent-related data can be grouped by agent name, agent status, agent location, or groups that the agent is in.
Interactions details
Interaction details consist of metrics about inbound interactions. For example, the telephone number of the caller, the number they dialed to reach Vonage Contact Center, the name of the queue that Vonage Contact Center routed their Interaction to, the time it took an agent to answer, and the interaction's various states while in progress or final state when complete.
Interaction details data can be grouped by the GUID, audio problems or disposition code of the interaction.
If the Data Source Mappings feature is available for your account, along with standard metrics, any mapped names in your account are available as custom metrics in interaction details. For information about viewing data source data in Real-time Analytics dashboards, see Viewing mapped data source data in Real-time Analytics.
Queues
Widgets configured to display queue-related data contain totals and averages relating to numbers of interactions in queues and the time spent in those queues.
Queue-related data can be grouped by queue name, media type, skill combinations, and individual skills.
What metrics does each data type contain?
Widgets contain specific data (metrics) about the individual data types. For information about which metrics each data type contains, see Real-time Analytics metrics.
What are the different types of widgets?
Seven different types of widgets are available. Each widget can display different metrics.
Big Number
Big Number widgets display a single number, time, percentage or fraction depending on the metric.

Metrics available in Big Number widgets
Examples
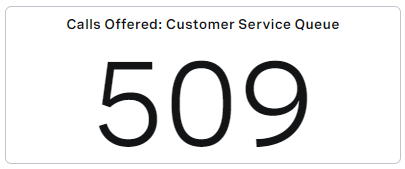
Big Number widget that displays the number of interactions of call type offered to the Customer Service queue since your contact center opened today:
Big Number widget that displays the longest wait time for interactions requiring a specific skill:

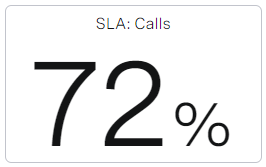
Big Number widget that displays the percentage of interactions of call type that met their Service Level today:
Big Number widget that displays the number of available agents as a fraction of the total number of agents in the VIP queue:

For example, you might have a Big Number widget that displays the number of currently waiting interactions of call type.

Donut
Donut widgets display a single metric in a donut chart. Donut charts are most valuable in displaying how a specific metric is split up. For example, when displaying the Agent Status Details metric, a donut displays the number of agents in each state. Or, when displaying the Offered metric by Queues, you can see how offered calls are split between queues.

Metrics available in Donut widgets
Examples
Donut widget that displays the states of the agents in the specified queues:

Donut widget that displays the number of calls offered by queue:

Gauge
Gauge widgets display a single metric in a gauge chart along with either a percentage or a fraction. Gauge widgets add a visual element to certain metrics that could otherwise be displayed in Big Number widgets.

Metrics available in Gauge widgets
Examples
Gauge widget that displays the percentage of calls, requiring a specific skill or skills, that were abandoned:

Gauge widget that displays the number of available agents as a fraction of the total number of agents in a queue:

Trend
Trends widgets display a chart that represents queue-related data at 15-minute intervals during a configured timeframe. Trend widgets can be single- or multi-series charts. A single-series chart displays a single metric. A multi-series chart can display two or more compatible metrics with each metric appearing as a series, or a single metric that can be broken down by group (queue, skill or media type) with each group appearing as a series.

Metrics available in Trend widgets
Examples
Single-series Trends widget that displays the number of calls offered in the last 12 hours:

Multi-series Trends widget that displays answered and abandoned calls in the last 12 hours:

Multi-series Trends widget that displays answered interactions grouped by media type in the last 12 hours:

List
List widgets display a list of metrics within a chosen data type. The data appears in a table. Each List widget requires a key metric which is automatically added to the first column of the list; the key metric depends on the selected metrics' data type. The columns in the table in a List widget can be reordered.

| Data Type | Key Metric |
|---|---|
| Agents | Agent Name |
| Interactions Details | Guid |
| Queues | Queue, Media Type, Skills, or Skill |
Metrics available in List widgets
Timelines in List widgets
List widgets that show interaction details can show timelines of events within individual interactions. Clicking on an interaction in the list opens a timeline of that interaction. A timeline displays the interaction and its associated events in combination with the interaction activities of all agents involved in the interaction (main agent, consulted agent, transferred agent). The interaction's state is broken down into time spent in:
- IVR
- Queues
The agents' presence states include the times spent in ringing, connected, hold, and wrap states for the during of the specific interaction.
Different colored blocks on the timeline represent different events and activities; hovering over the different blocks in the timeline show the duration of the events and activities.
For more information about timeline widgets, see Viewing interaction details in a Real-time Analytics timeline and a table.
Download CSV data
If enabled for your account, any user can download the data presented in the List widgets. The user can also download all data about a specific interaction from a List widget containing interaction metrics. For information about downloading data, see How do I download the content of a List widget in CSV format? and How do I download an interaction's data in CSV format? in Using Real-time Analytics. For more information about turning the downloading of data on or off, see Dashboards - users can download widget data in Controlling features for your account.
Examples
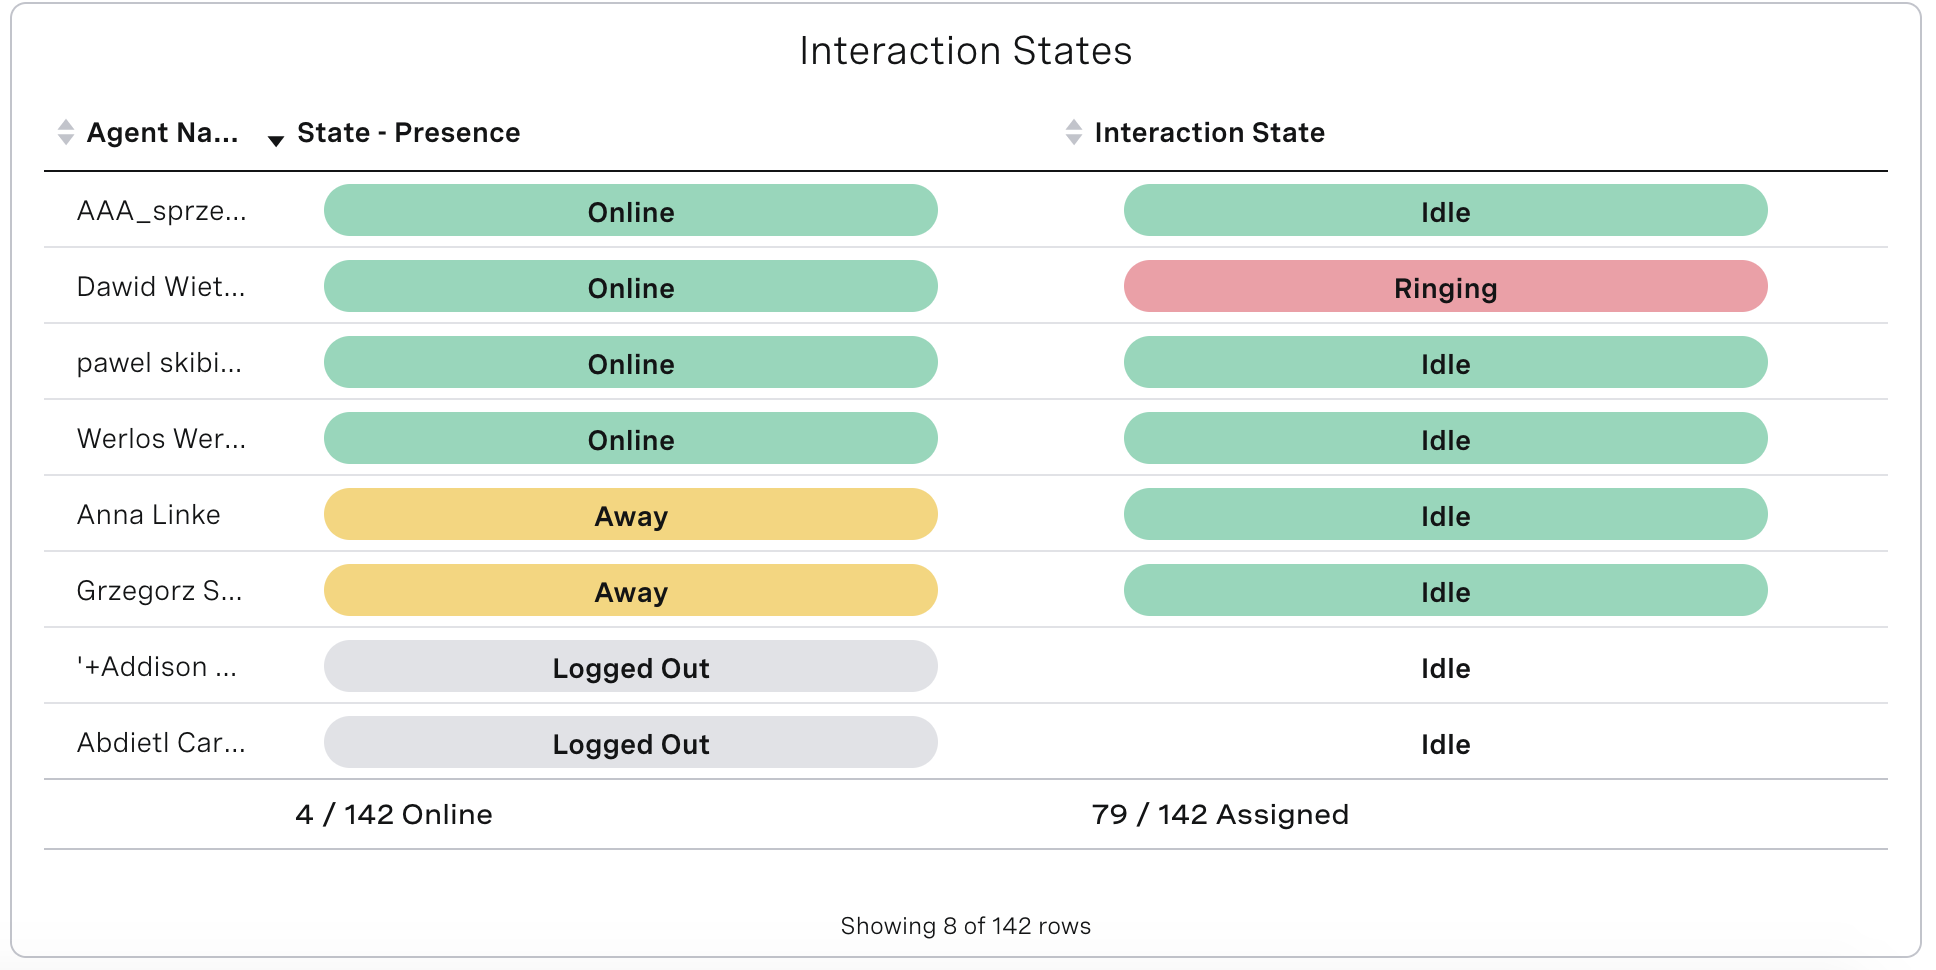
List widget that displays the current presence statuses and interaction states of agents in the account:
List widget that displays the agents who have made the most outbound calls in the last hour:

List widget that shows the queue with the most interactions offered today:

List widget that shows a timeline:

Multi Big Number
Multi Big Number widgets display matrices of big numbers (as displayed in Big Number widgets). These widgets effectively group several Big Number widgets within a single widget. All numbers in the Multi Big Number widget must be of the same data type. Configured filters apply to all metrics in the widget, but any thresholds apply to individual metrics.

Metrics available in Multi Big Number widgets
Multi Big Number widgets can display the same metrics as Big Number widgets.
Examples
Multi Big Number widget that displays a collection of big numbers relating to agent calls:

Multi Big Number widget that displays a collection of big numbers relating to calls to queues:

What metrics does each widget type contain?
The different widget types can display different metrics. For information about which metrics each widget type can display, see Real-time Analytics metrics.
What are thresholds?
Thresholds draw attention to a widget or a value in the widget by changing the widget or value's color depending on the displayed value.
Only non-text metrics can have thresholds. The following metrics are text metrics:
- Agent ID (Agents, Interactions Details)
- Agent Name (Agents, Interactions Details)
- Current Media Type (Agents)
- Groups (Agents)
- Interaction Plan (Interactions Details, Queues)
- Interaction State (Agents, Interactions Details)
- Media Type (Interactions Details)
- Physical Location (Agents)
- Queue (Queues)
- Skill (Queues)
- Service Name (Interactions Details, Queues)
- Skill (Queues)
- Skills (Agents, Interactions Details)
- State - Presence (Agents)
For example, you might have a Big Number widget that displays the number of calls offered to a specific queue since your contact center opened today. This widget could have a threshold of 120, meaning that the widget changes color if the number of inbound calls exceeds 120. The color change will alert users that the threshold has been exceeded and they might need to take action.

For example, you might have a List widget with thresholds on the Offered and Breakouts (Total) columns. The values in the list are highlighted in the specified color if they exceed the threshold.

For example, you might have a Multi Big Number widget with thresholds on some or all of the values. The colors of the values in the widget indicate that they have exceeded the threshold.

For example, you might have a Gauge widget with a threshold on the percentage of abandoned calls.

Threshold notifications
Dashboards can send system notifications when widget values exceed the configured threshold. Dashboards send notifications about thresholds even if the dashboard window is not active. Clicking on a notification message opens the dashboard window that sent the notification, and highlights the widget that contains the exceeded threshold.
When notifications are turned on, whenever a value crosses a red, orange, or green—but not white—threshold a system notification is sent.
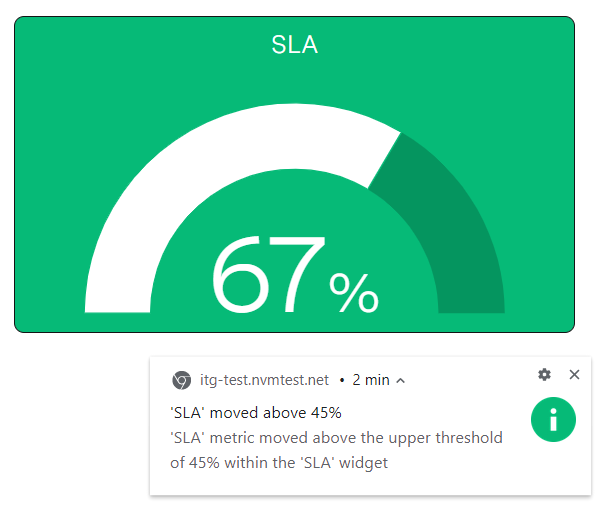
For example, you might have a Gauge widget configured with following thresholds for Service Level values:

The widget will change from green to orange and will send notification when the Service Level value drops to less than 45%.

When the Service Level value drops further to value less than 30%, the widget's color changes to red, and another notification is sent.

When the Service Level value increases to 45% or above, the widget is green, and another notification appears:
Where does data come from?
Widgets display statistical data retrieved using Vonage Contact Center's Insights Stats API.
Who can access Real-time Analytics dashboards?
By default, supervisors can access their own dashboards—that is, dashboards that they created—and shared dashboards—dashboards that other supervisors created and shared.
By default, agents cannot access dashboards. If enabled for your account, agents can access individual dashboards using direct links. This access is read-only. For information about accessing dashboards as an agent, see Viewing a Real-time Analytics dashboard as an agent.
For general assistance, please contact Customer Support.
For help using this documentation, please send an email to docs_feedback@vonage.com. We're happy to hear from you. Your contribution helps everyone at Vonage! Please include the name of the page in your email.