Viewing interaction details in a Real-time Analytics timeline and a table
A timeline shows what happened — and when — during an interaction. Each party involved in the interaction appears in its own row, each row consisting of colored blocks representing events.
You can see timelines for both completed and ongoing interactions. The blocks that represent ongoing events are colored in a gradient, starting with a solid color on the left and becoming transparent on the right.
Data is refreshed automatically every few seconds, which is especially valuable while observing ongoing interactions.
Possible interaction events that can be presented on a timeline
| Event | Description | Color | Party |
|---|---|---|---|
Ringing | The time that the interaction was being offered to the party. |
| external, agent |
Agent Queue | The time in which an agent was queuing during a warm transfer to queue. | agent | |
Queue | The time in which an external party was in a queue waiting to be answered. | external | |
Connected | The time that the party was connected and capable of communicating with other connected parties | external, agent | |
Held | The time for which the party was placed on hold. A Held event may overlap a Connected event. | external, agent | |
| Held - Parked | The time for which the party was placed on hold as the interaction was parked. A Held - Parked event may overlap a Connected event. |
| external, agent |
| Held - Interrupted | The time for which the party was placed on hold as the interaction was interrupted. A Held - Parked event may overlap a Connected event. |
| external, agent |
Delivery Failed | The interaction was not answered. |
| agent |
| Wrap | The time in which the agent is in a Wrap state. |
| agent |
How do I display a timeline for an interaction?
A timeline is available in a List widget that contains Interaction Details metrics. To display a timeline for an interaction, click the interaction in the row in the list. A dialog box opens containing interaction detail metrics and the timeline both of which update in real time. It helps to not lose the context of the interaction that you are observing.
Hover over these blocks to see details, like duration, entered queue, and so on.
Examples
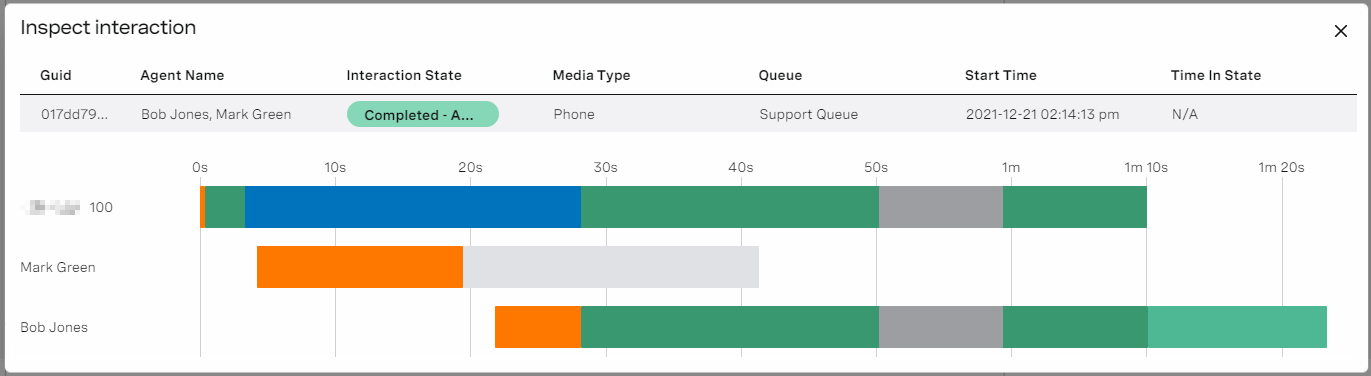
In this example, a call from a telephone number ending with 100 arrived at Vonage Contact Center. The caller spent some time in IVR before entering a queue. Agent Mark Green's phone rang, but the agent did not answer. A few seconds later the second agent (Bob Jones) answered the call. During the call agent Bob Jones put the call on hold. After retrieving the call, the agent was connected for a short time before releasing. Then, he spent his time on wrapping up for a few seconds.
In this example, a call from telephone number ending with 943 arrived at Vonage Contact Center. The caller spent some time in IVR before entering a queue. Agent Helspeth G's phone rang, and the agent answered. During the call the agent put the call on hold. After retrieving the call, the agent was reconnected with the caller for at least 3 minutes and 26 seconds. The call is ongoing and therefore the most recent Connected event is transparent on the right side.

Under the linear visualization of the interaction is a table that contains a detailed list of events and applets involved in the interaction.
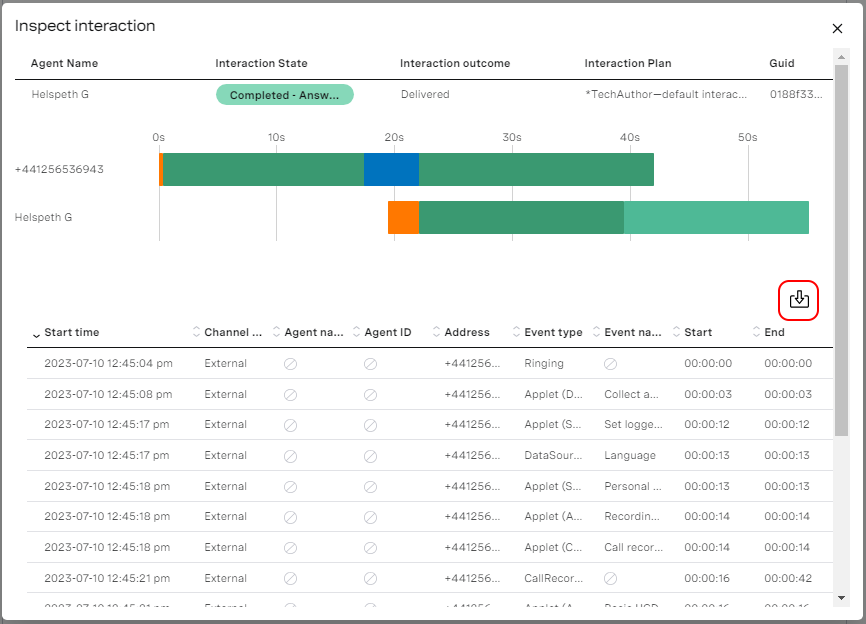
All the events and applets are reported from the beginning of the interaction to the end. Click the headers of the table to change the sorting of the columns. If enabled for your account, to download the data in the table in CSV format, click the download icon in the top-right corner of the table. For information about turning the export of interaction data on and off, see Dashboards - users can download widget data in Controlling features for your account.
For general assistance, please contact Customer Support.
For help using this documentation, please send an email to docs_feedback@vonage.com. We're happy to hear from you. Your contribution helps everyone at Vonage! Please include the name of the page in your email.