...
| Panel | ||||||||||||||
|---|---|---|---|---|---|---|---|---|---|---|---|---|---|---|
| ||||||||||||||
|
Licenses
To access Analytics, you need to have a Viewer or Creator license. Depending on which license you have, you can perform different tasks in Analytics.
| Task | License | |
|---|---|---|
| View | Creator | |
| Access Analytics | ||
| View dashboards | ||
| Filter data in dashboard | ||
| Download dashboard | ||
| Schedule delivery of dashboard | ||
| Create dashboard | ||
| Copy dashboard | ||
| Edit dashboard | ||
| Delete dashboard | ||
Accessing Analytics
Only users with Viewer or Creator licenses can access Analytics. For more information about licenses, see the Who can access Analytics? section in Overview of Historical Analytics.
...
To view an existing dashboard, click the tile. The dashboard appears.

Displaying dashboards
To maximize the space available to display dashboards, you can:
- Use full page view (1)
- Hide dashboard filters (2)

Viewing dashboards
To view available dashboards, you need to have a Viewer or Creator license. When viewing an Analytics dashboard, you can filter the data on the dashboard using the filters at the top of the dashboard. To explore the data in an individual tile, click the three dots in the top-right corner and then click Explore from here. For more information about viewing dashboards in Looker, see Viewing dashboards (Looker help).
Creating a new dashboard
To create a new Analytics dashboard, you need a Creator license. Go to the Custom dashboards tab and click Create Dashboard in the top-right corner. Type a title for your dashboard in the dialog box that appears. Click Create dashboard. You are redirected to your newly created dashboard. By default, the dashboard is empty.
...
The newly created dashboard is saved in a collection of custom dashboards.
Copying existing dashboards
Copying an existing dashboard creates a new custom dashboard. If you have a Creator license, you can copy default or custom dashboards.
...
After providing a name, a new dashboard containing all tiles from the original dashboard appears. You can now change all tiles. The new dashboard is a custom dashboard and will be saved along with other custom dashboards.
Editing custom dashboards
If you have a Creator license, you can edit custom dashboards. To start editing a new or existing custom dashboard, click Edit Dashboard. When in edit mode, you can add new text or visualization tiles. You can also add filters and change dashboard settings. Anyone with a Creator license can perform all actions listed in the dashboard menu.
...
Anyone with a Viewer license can only download a dashboard, reset filters and change viewer's time zone.

Creating a new tile in a custom dashboard
To add a tile to your dashboard, click Edit dashboard, either in the center of an empty dashboard, or from the menu in the top-right corner of the dashboard.
Empty dashboard

Existing dashboard

When the dashboard is in edit mode, click Add Title, either in the center of an empty dashboard or from the configuration bar in the top-left corner of the dashboard.
Empty dashboard

Existing dashboard

Choose either Visualization or Text.
Creating a text tile
Add text tile to put some static text — title, subtitle, and body — on the dashboard. This text may describe the entire dashboard or a section of it.
Creating a visualization tile
Add a visualization tile to display agent events or interaction events. Looker documentation refers to visualization tiles as query tiles. In a visualization — or query — tile, firstly choose an Explore depending on the data you want to display — either Agent Events, Groups, Interaction Events, Interaction Summary, Skills, or Users.
Exploring data
After choosing an Explore (Agent Events, Groups, Interaction Events, Interaction Summary, Skills, or Users), you can see all the available data you can with on when creating a tile. On the left you can see s field picker containing filter-only fields, dimensions, and measures. Use the tooltip alongside each dimension and measure to see its description. For information about all the fields in each explore, see Historical Analytics fields.

To specify the data you want to appear in the tile, click required dimensions and measures. In Looker, dimensions appear as blue columns and measures appear as orange columns in the data table. Click Run to see the data.
...
For more information about exploring and pivoting data, see Exploring data in Looker (Looker help).
Filtering data
To filter results displayed in a data table, add dimensions or measures, or both, to the Filters section.
...
For more information about filtering and limiting data, see Filtering and limiting data (Looker help).
Visualizing data
To choose the visualization type that is most suited to your needs, expand the Visualization section.
On the top bar, choose the type of the visualization. Each type has an option panel where you can configure visualization details, such as formatting values, showing labels and numbers, choosing color palettes etc.
...
| Note | ||
|---|---|---|
| ||
| When you add or modify a tile, you must save that tile and save the dashboard otherwise your changes are lost. |
Setting or changing default filter settings
When viewing dashboards, viewers can filter dashboard data according to available filter settings. Most dashboards have filters that refine the data in all the tiles on that dashboard. Newly created dashboards do not have filters until configured. Default dashboards are configured with default filter settings.
...
When you have finished making changes, click Add or Update. As a final step, to save the whole dashboard, click Save in the top right corner.
Changing default time zone
All default dashboards display data by default in the viewer's time zone according to their browser’s configuration.
...
Now all data in the tiles in the dashboard will be displayed in the selected time zone unless the viewer chooses a different time zone.
Scheduling delivery of a dashboard
If a user does not have access to Analytics, but you have a Creator or Viewer license, you can send the user an email containing a copy of a dashboard. You can send the email to an individual user or to a group recipients either immediately or on a repeat basis. To send a dashboard, you must be viewing the dashboard (not in edit mode). Go to Dashboard actions and click Schedule delivery.
...
For more information about visualizing and option settings, see Scheduling and sending dashboards (Looker help).
Downloading data
Anyone who can access Analytics can download dashboard data. To download data, the dashboard must be in view — not edit — mode. You can download either the whole dashboard or an individual tile.
Downloading whole dashboard
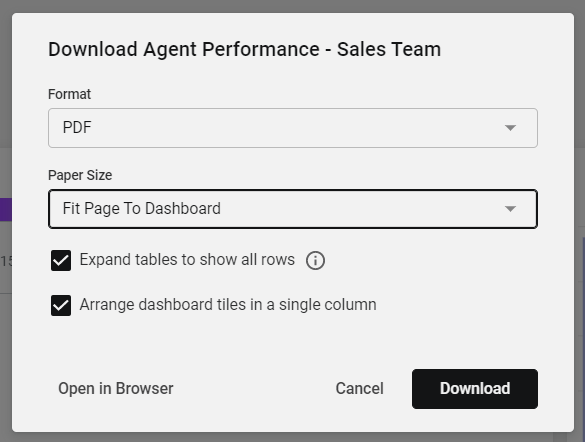
To download whole dashboard, go to Dashboard actions and click Download.
...
- PDF. The dashboard is saved in a PDF file and looks the same as when viewing the dashboard in Analytics. We recommend that you click to select both of the Expand tables to show all rowsand Arrange dashboard tiles in a single column check boxes to include the whole data set and to show the data more clearly.
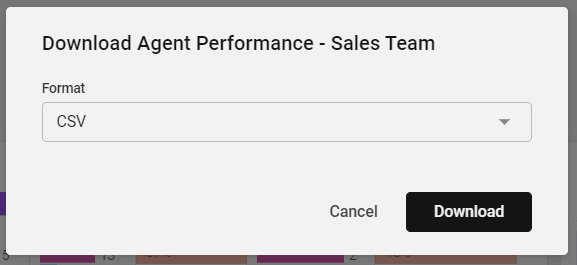
CSV. The dashboard's data is downloaded in a ZIP (.zip) file containing multiple CSV (.csv) files. Each CSV file represents a tile on the dashboard.
Note If you download the whole dashboard in CSV format, the downloaded data will be limited to the number of rows configured in the tile to a maximum of 5000 rows. To download more data, you need to download a single tile. For more details, see the Downloading an individual tile section later in this page.
Downloading an individual tile
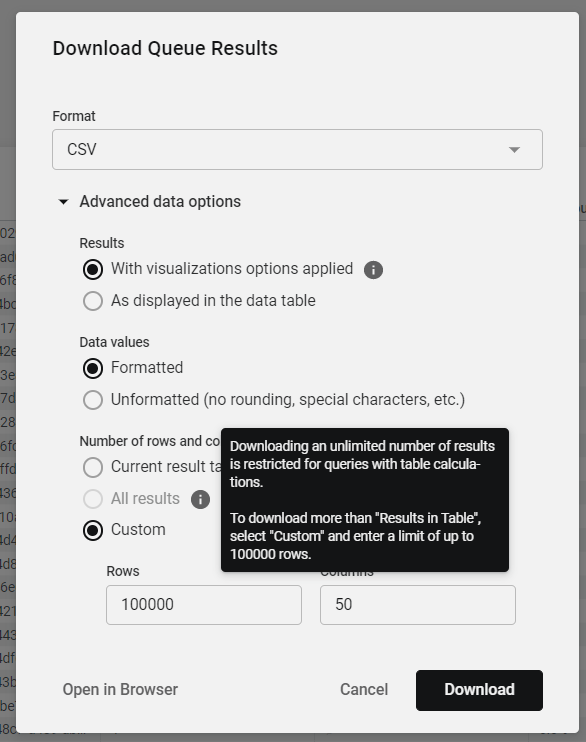
To download a specific tile, click the three dots alongside its name and click Download data.
...
| Info | ||
|---|---|---|
| ||
We recommend that you always set Number of rows and columns to include to All results. The All results option won't be available if you are using table calculations within the tile. You can either remove calculated fields or select the Custom option and specify the maximum number (100,000) of rows.
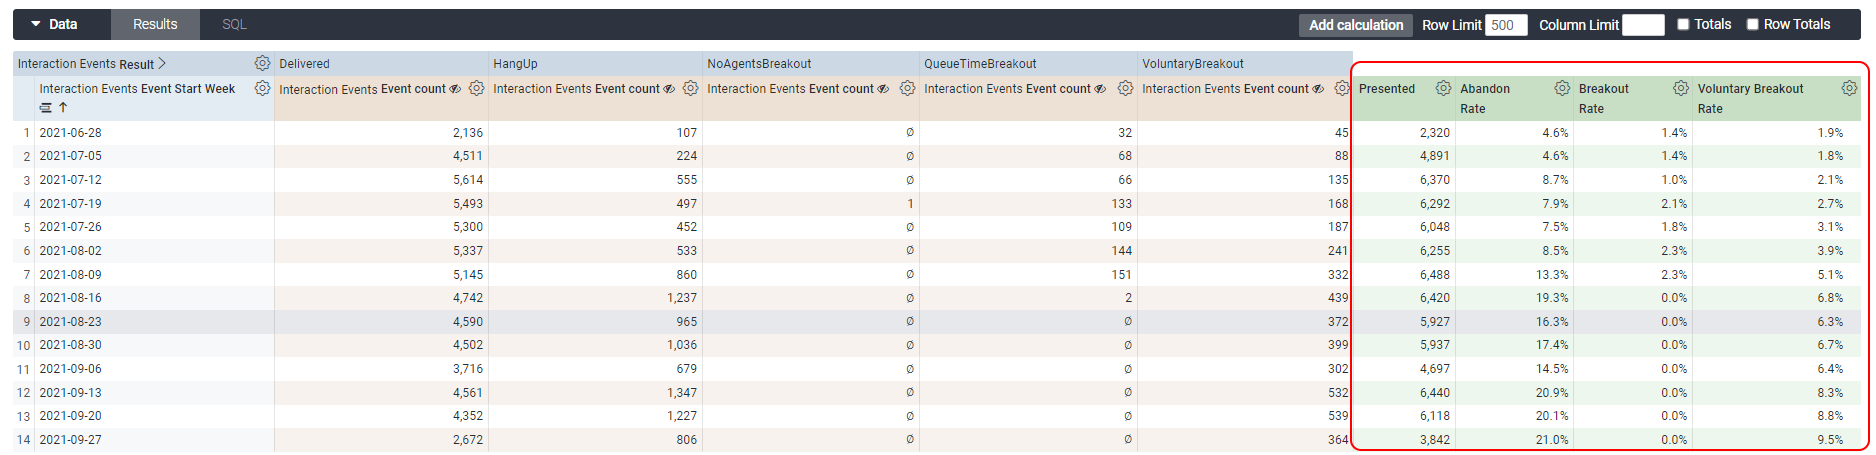
Table calculations are represented in green under the Data section.
|
Deleting custom dashboards
To delete a custom dashboard, you need a Creator license.
...