Viewing agent summary state details in a Real-time Analytics timeline
A timeline shows a summary of the states an agent has been in during the timeframe of the widget. Each summary state appears in its own row, each row consisting of colored blocks representing states.
You can see timelines for the agent's previous and ongoing summary states. The block representing the agent's ongoing state is colored in a gradient, starting with a solid color on the left and becoming transparent on the right. The block representing the first state the agent was in during the timeframe is colored in a gradient, starting as transparent on the left and a solid color on the right.
Data is refreshed automatically every few seconds, which is especially valuable while observing ongoing agent states.
Agent summary states that can be presented on a timeline
| State | Description | Color |
|---|---|---|
Idle | Idle signifies that the agent had no active interactions and could handle incoming interactions. |  |
Busy | Busy indicates that the agent was actively involved one or more interactions. |  |
Wrap | Wrap represents the time after an interaction has ended, during which the agent completed related tasks like updating records or documenting the interaction. |  |
Away | Agent indicates that the agent was temporarily unavailable, during a comfort break, for example. |  |
Extended away | Extended away represents a longer period of unavailability, when the agent couldn't handle interactions for an extended period, such as during a lunch break or a meeting. |  |
| Logged out | Logged out indicates that the agent was not logged in, signifying no availability to handle interactions. |  |
How do I display a timeline for an agent?
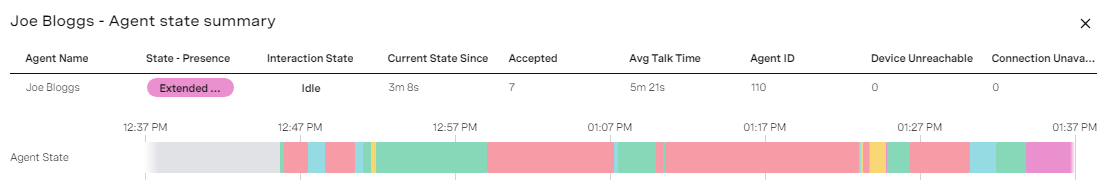
A timeline is available in a list widget that contains agent metrics. To display a timeline for an agent, click the agent in the row in the list. A dialog box opens containing a table of agent metrics and a timeline of the agent's summary, both of which update in real time. It helps to not lose the context of the agent that you are observing.
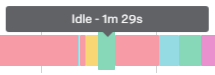
Hover over a block to see how long the agent was in the summary state at that time.
In the following example, the timeline shows the agent's summary states for a 1-hour timeframe as configured in the list widget.
At the start of the timeframe, the agent was logged out. The agent then spent time in all possible summary states. At the end of the timeframe, the agent was in an ongoing state of extended away.
Under the linear visualization of the timeframe is a table containing a detailed list of agent summary states.
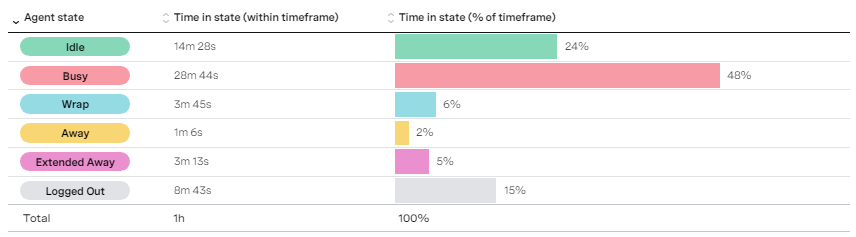
The data in this table indicates that the agent was busy handling interactions for 28 minutes and 44 seconds which was 48% of the timeframe. They also spent 14 minutes and 28 seconds (24%) ready but not handling interactions. Data for the other summary states is also available.
All the agent's summary states are reported from the beginning of the timeframe to the end. Click the headers of the table to change the sorting of the columns. If enabled for your account, to download the data in the table in CSV format, click the download icon  in the top-right corner of the table. For information about turning the export of agent summary state data on and off, see Dashboards - users can download widget data in Controlling features for your account.
For general assistance, please contact Customer Support.
For help using this documentation, please send an email to docs_feedback@vonage.com. We're happy to hear from you. Your contribution helps everyone at Vonage! Please include the name of the page in your email.