Analytics dashboards are made up of individual tiles. Each tile displays chosen data in the chosen form.
Currently tiles show data about agent events, groups, interaction events or summary, skills, and users — this data is the same data that used in Dashboards and Insights Stats API. Conversation Analyzer data In Looker, data is contained in fields. Fields can be of three types: Each field has a tooltip that describes the field's content. Historical Analytics course We now have a dedicated Historical Analytics course in our Vonage Academy. For more information, see Analytics course.
Accessing Analytics
Only users with view licenses can access Analytics. For more information about licenses, see the Who can access Analytics? section in Overview of Analytics.
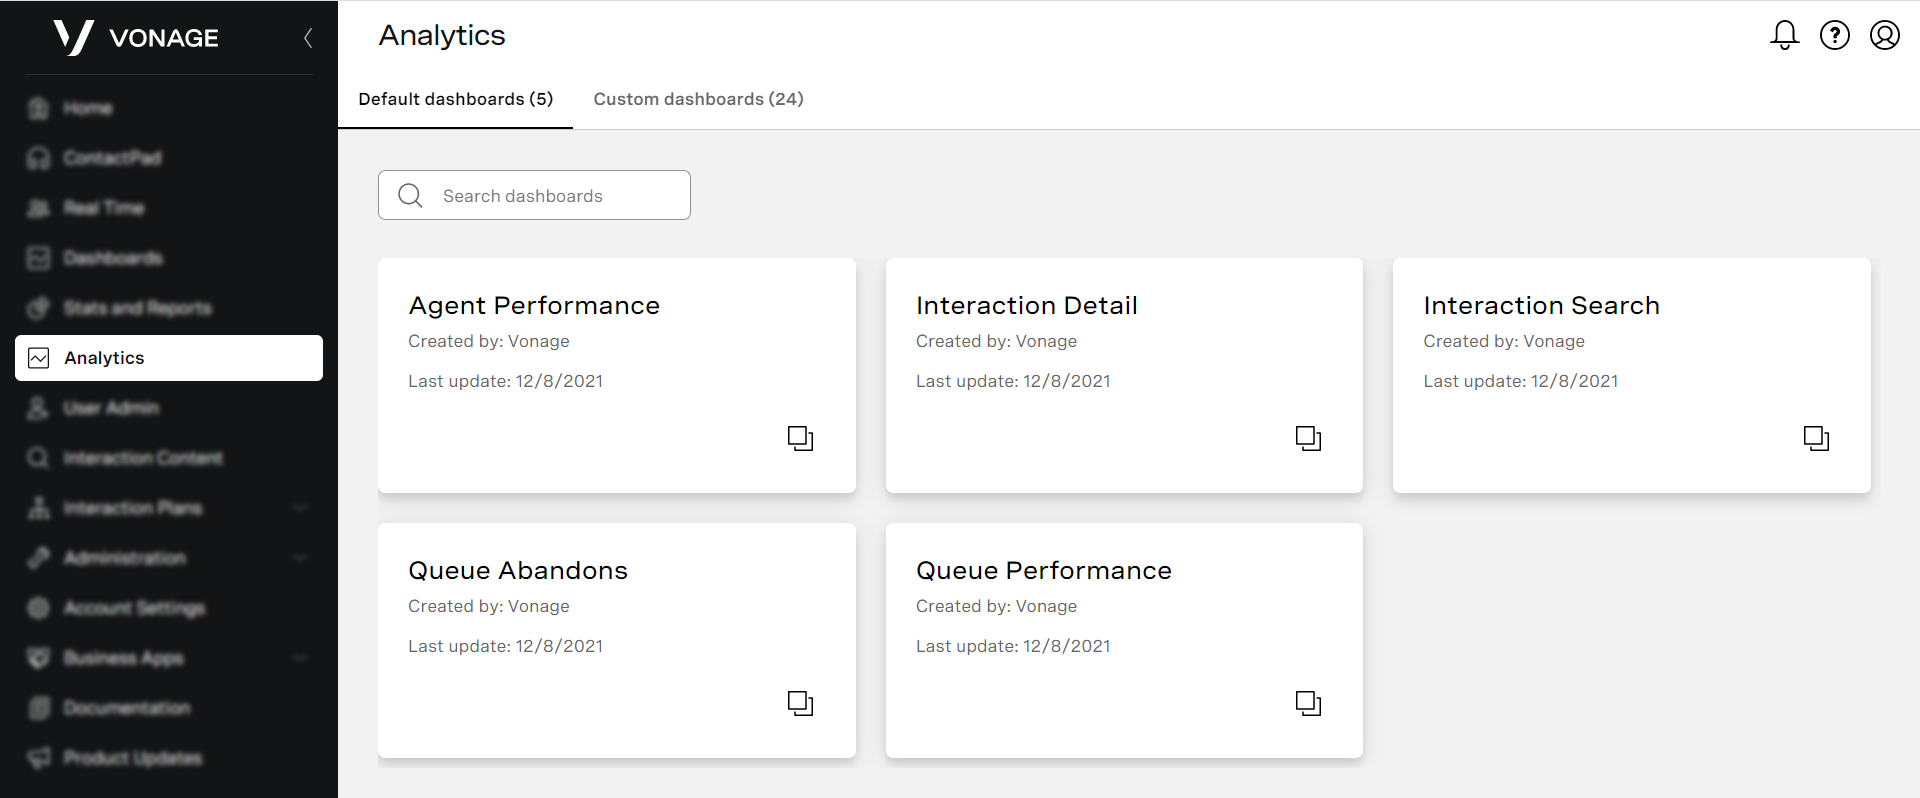
To access Analytics, go to Analytics on the VCC admin portal menu. Existing default and custom (if available) dashboards are displayed in tiles in according tabs. For information about available default dashboards, see Default Analytics dashboards.
To view an existing dashboard, click the tile. The dashboard appears.
Displaying dashboards
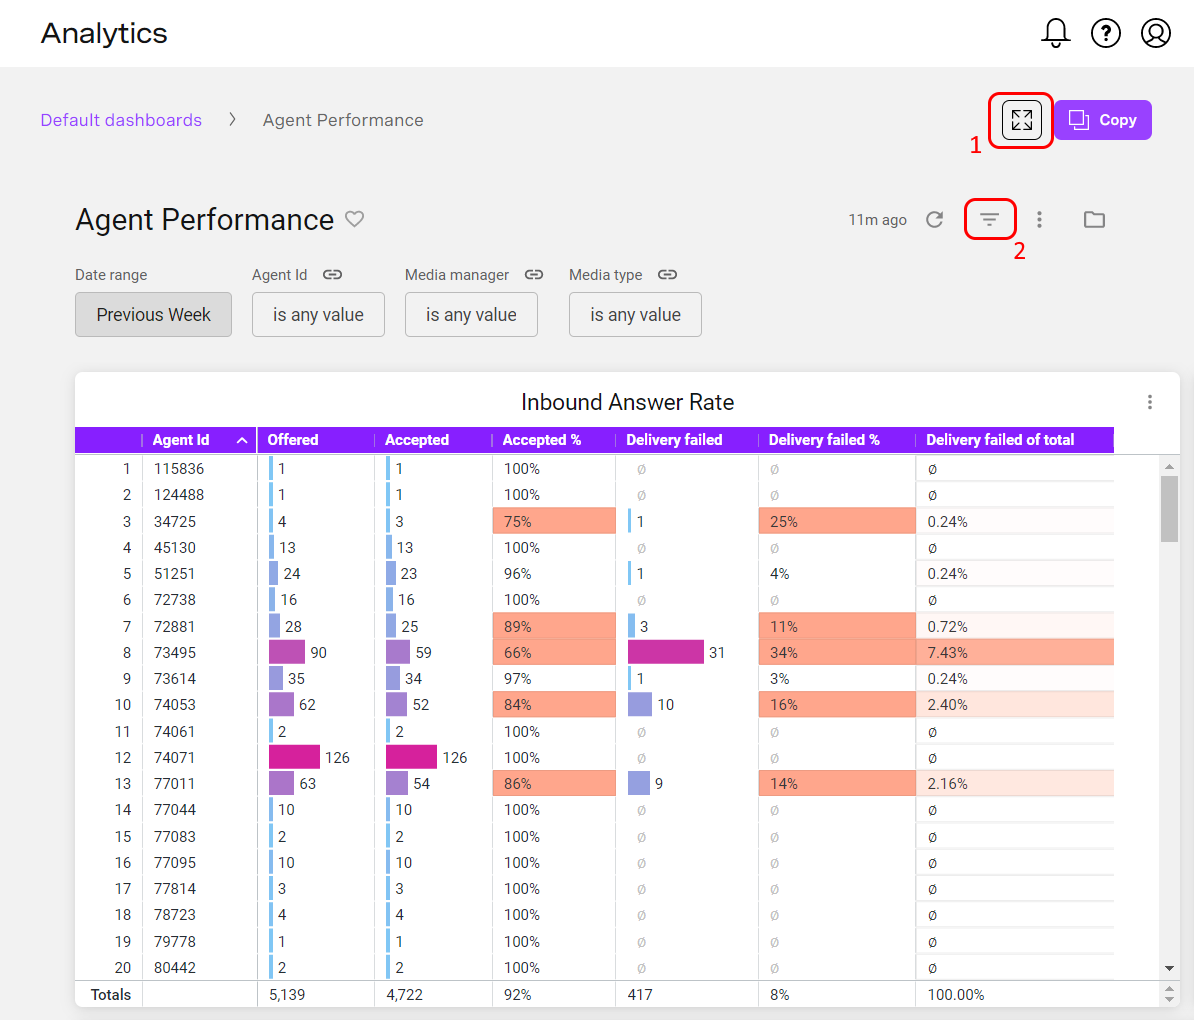
To maximize the space available to display dashboards, you can:
- Use full page view (1)
- Hide dashboard filters (2)
Viewing dashboards
To view available dashboards, you need to have a view license. When viewing an Analytics dashboard, you can filter the data on the dashboard using the filters at the top of the dashboard. To explore the data in an individual tile, click the three dots in the top-right corner and then click Explore from here. For more information about viewing dashboards in Looker, see Viewing dashboards (Looker help).

