Overview of Historical Analytics
The Historical Analytics area of the Vonage Contact Center Admin Portal (VCC) presents historical data from your VCC account activity. Historical Analytics consists of default and custom dashboards. Historical Analytics is integrated with a Business Intelligence (BI) tool called Looker and uses its embedded view. Looker is Google's BI tool for visualizing and displaying data.
What is Looker?
Looker is Google's BI tool for visualizing and displaying data. For more information about Looker, see the Looker resources page.
Embedded view
What are Historical Analytics dashboards?
A dashboard is a collection of tiles, displaying data about agent events, groups, interaction events or summary, skills, and users. Historical Analytics offers two types of dashboards:
- Default. The collection of default Historical Analytics dashboards is owned by Vonage and includes common ways of displaying data within a contact center. For information about the default dashboards available and what they contain, see Default Historical Analytics dashboards.
- Custom. Custom Historical Analytics dashboards owned by the creator. Users can create completely new custom dashboards or create them from copies of existing dashboards.

What are tiles?
A tile is a single item on a Historical Analytics dashboard. Tiles can be one of two types:
- Text tiles contain static text.
- Visualization tiles contain configured data and have various configuration options. For more information see What visualization options are available for tile? section later this page.

What data can be displayed in tiles?
Currently tiles show data about agent events, groups, interaction events or summary, skills, and users — this data is the same data that used in Dashboards and Insights Stats API.
Conversation Analyzer data
In Looker, data is contained in fields. Fields can be of three types:
- Filter-only field. Used for filtering data only.
- Dimensions. Data about an agent or interaction event that can be displayed, or filtered or grouped by.
- Measures. Perform calculations on all the data in relevant dimensions such as totals, averages, durations, minimums, maximums, and percentages.
Each field has a tooltip that describes the field's content.

A tile can contain one type of data at any time — agent event, group, interaction event or summary, skill, or user.
Agents
Each row of data represents a single agent. The data is presented for all users with an agent license, or with supervisor or admin licenses if allowed to act as agents. The Agents set of data can be accessed within Agent Events, Interaction Events, Groups, and Users explores.
Within Agents you can report on:
Email
Licence
Name
Phone number
Physical location
Username
WebRTC
For a complete list of agent event fields and their descriptions, see Agents fields.
Agent events
Each row of data represents a single event for an agent. Agent events can be one of two types — presence and interaction — and each event also has a category:
- Presence
- Ready
- Away
- ExtendedAway
- LoggedOut
- Interaction
- Ringing
- Connected
- Wrap
- Unexpected
- Failed
Other agent event data includes start time and date, duration of event, and agent ID. Average, maximum, and minimum duration, and count measures are also available. The Agent events set of data can be accessed within the Agent Events explore.
For a complete list of agent event fields and their descriptions, see Agent events fields.
Groups
Each row of data represents a single group and its settings. When agent and group dimensions are shown, a row of data represents a group and agent combination, where the agent is in the group. Within groups you can report on:
- Group display ID
- Group name
- Maximum unexpected time
- Maximum wrap time
- Agent ID (ID of agent in the group)
Count, maximum unexpected, maximum wrap, and group list measures are also available. The Groups set of data can be accessed within Agent Events, Groups, Interaction Events, and Users explores.
For a complete list of groups fields and their descriptions, see Groups fields.
Interaction events
Each row of data represents a single interaction. Interactions can have channels, events, start and end dates, and so on. Interaction events have many more dimensions and measures than agent events. The Interaction events set of data can be accessed within Interaction Events explore.
For a complete list of interactions fields and their descriptions, see Interaction events fields.
Interaction model
Interaction event data describes every call or other type of interaction in a 4-layer structure, each with its own properties or fields:
- Interactions
Each interaction has information applicable to the interaction as a whole. Information includes when it started, its status — completed, ongoing, internal error — and its direction — inbound, outbound or internal.
Interactions have one or more channels:- Channels
A channel represents a party who is connected or attempted to be connected to the interaction. If a party leaves and rejoins, there are two channel instances associated with that party. A party can be external, an agent, or a monitor (a supervisor monitoring an interaction).
Channels have one or more channel events:- Channel Events
A channel event represents each human or system activity instigated by or affecting the channel — party — or the interaction. Examples of channel events include Ringing, DeliveryFailed, Connected, Applet, Queue, Held, CallRecording, Disposition, Wrap. Multiple channel events can occur at the same time. For example, a Held channel event can occur within a Connected channel event.
Each channel event has a type, an offset (by default, in milliseconds from the start of the interaction), and a duration (by default, in milliseconds). Queue, Applet and some other events carry a Customer-defined Name- Channel Event Properties
Some channel events, specifically Queue channel events, have additional properties. A queue channel event has a result — for example, HangUp, Delivered or a range of breakouts — a list of presented skills, and virtual queue (or agreement) names.
- Channel Event Properties
- Channel Events
- Channels
All interactions have a conversation GUID. A conversation GUID connects all interactions that make up a conversation. For example, a conversation may contain an initial phone call and a callback — both interactions will have the same conversation GUID, but different interaction GUID.
Interaction summary
Interaction summaries include data that can describe the lifecycle of the interaction. This data includes, for example, for an inbound interaction, when it started, the interaction plan it started in, what happened in the queue, the agent it was routed to, and how long it lasted. Other data includes whether any issues with call quality were reported, if the interaction was analyzed, and whether a payment was taken.
Several measures are available, including count, Mean Opinion Scores (MOS), and wrap time. The Interaction summary set of data can be accessed within Interaction Events and Interaction Summary explores.
For a complete set of interaction summary fields and their descriptions, see Interaction summary fields.
Skills
Each row of data represents a single skill and its settings. When agent and skill dimensions are shown, a row of data represents a skill and agent combination, where the skill is assigned to the agent. Within skills you can report on:
- Skill display ID
- Skill name
- Skill level
- Agent ID (ID of agent in the group)
Count and skills list measures are also available. The Skills set of data can be accessed within Agent Events, Interaction Events, Skills, and Users explores.
For a complete list of skills fields and their descriptions, see Skills fields.
Users
Each row of data represents a single user. The data is presented for all users that exist in your account, including archived ones. The Users set of data can be accessed within Users explore.
Within Users you can report on:
Active
Agent configuration
Agent ID
Phone number
Physical location
WebRTC
Days since last login
Email
Last login date Date
Licence
Locked
Name
User ID
Username
For a complete list of users fields and their descriptions, see Users fields.
What visualization options are available for tiles?
Tiles display data in different forms, or visualizations. Visualizations can be divided to different types, where each type has different settings you can use to customize its look. Different data works better in some visualizations than others.

Visualizations can be of the following types:
- Cartesian charts
Column
Bar
Scatterplot
Line
Area
- Pie and donut charts
Pie
Donut Multiples
- Progression charts
Funnel
Timeline
Waterfall
- Text and table
Single Value
Single Record
Table
Table (Legacy)
Word Cloud
- Maps
- Map
- Static Map (Regions)
- Static Map (Points)
- Other charts
- Boxplot
For detailed information about each Looker's visualization types, see Visualization types (Looker help).
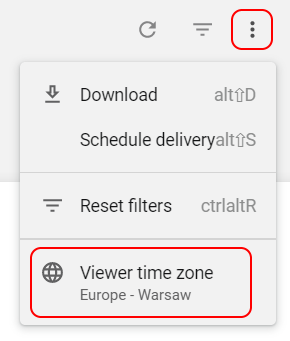
What time zone is the data displayed in?
The data in default Historical Analytics dashboards is displayed according to the viewer's time zone. The time zone is taken from the viewer's browser configuration. To change the dashboard's time zone, go to Dashboard actions and select a new time zone.
Where does data come from?
Historical Analytics is powered by the same data used in Real-Time Analytics — Insights Stats API.
What range of historical data is available?
Historical Analytics can report on data from 14th February 2018 onwards. Data from before 14th February 2018 can be retrieved only from Stats and Reports.
Who can access Historical Analytics?
Anyone with a Viewer or a Creator Historical Analytics license can access Historical Analytics. For information about licenses in Historical Analytics , see Historical Analytics licenses and access.
What are the current limitations of Historical Analytics?
For general assistance, please contact Customer Support.
For help using this documentation, please send an email to docs_feedback@vonage.com. We're happy to hear from you. Your contribution helps everyone at Vonage! Please include the name of the page in your email.